May 15, 2025 | 22:33 GMT +7
Hotline: 0913.378.918
![]()
May 15, 2025 | 22:33 GMT +7
Hotline: 0913.378.918
![]()

Corn grains are loaded on a truck after being harvested at a farm near Brasilia, Brazil August 22, 2023. Photo: REUTERS/Adriano Machado.
Likewise, "China" and "imports" are often synonymous in global soybean trade because the country accounts for more than 60% of annual imports.
But what about the other customers? Who takes in the other 40% of soy cargoes, and how have these trends changed in recent years, especially with respect to each supplier?
This conversation has been pulled to the forefront of the market as the United States has threatened tariffs on many of its trade partners, who are contemplating measures of their own. This includes both Mexico and European Union countries, top destinations for U.S. farm goods.
At the same time, Brazil’s ballooning soybean crop has been increasingly able to supply global needs, slowly chipping away at U.S. soy exporters’ relevance.
China significantly reduced its reliance on U.S. soybeans during the first trade war in 2018, though that was largely possible at the time because of widespread disease throughout its hog herd, which significantly dented feed demand.
But for U.S. exporters, the pre-trade war levels were never restored, and U.S. soy shipments to China over the last three calendar years have fallen 12% from the 2015-2017 average. China increased its imports by 13% during that time.
Also during this time, Brazil expanded its soy exports to China by 51%, less than the 61% rise in the country’s total shipments. By comparison, U.S. soy exports to all destinations declined 2% in the same period as the focus on domestic demand increased.
On average over the last three years, about 72% of Brazil’s soy exports headed to China, compared with 76% between 2015-2017. This huge dependence on a single customer is perhaps the biggest vulnerability of Brazil’s export program.
About 53% of U.S. soy exports were destined for China over the last three calendar years compared with a three-year, pre-trade-war average of 59%.
European Union countries are collectively the second-largest soybean importing entity, accounting for about 8% of the global total. The EU is also the No. 2 destination for both Brazilian and U.S. soybeans.
Around 2000, Europe was Brazil’s present-day China, consuming almost two-thirds of the country’s soy exports. That share has averaged just 7% in the latest three years, though the volumes have risen over the last decade.
U.S. soy exports to the EU have also risen in recent years, though the average volumes remain slightly lower than those from Brazil. EU countries accounted for about 11% of U.S. shipments over the last three years.
However, U.S. soybean trade with the EU, which grossed $2.4 billion last year, could be in jeopardy. Brussels is expected on Wednesday to publish a policy potentially restricting agricultural imports treated with chemicals banned in Europe.
That could force U.S. exporters to explore new markets, assuming trade relations allow. Mexico is the United States’ second largest single-country soybean destination, accounting for about 10% of the annual total, though tariff threats also loom there.
Total Brazilian soy exports are nearly 80% larger by volume than their U.S. counterparts, but both countries over the last three years exported similar volumes to destinations other than China and the EU. This relatively greater diversity among the United States’ customers might be its only present advantage over Brazil’s booming business.
The future of U.S. soy exports could become less worrisome if domestic demand were to escalate in a manner implied by the aggressive biofuel mandates floated a few years ago.
But those plans, much like the tariff discussions, are in a holding pattern for now. This means that if the upcoming U.S. soy crop is not sufficiently large, next season’s shipments could be squeezed further.
(Reuters)
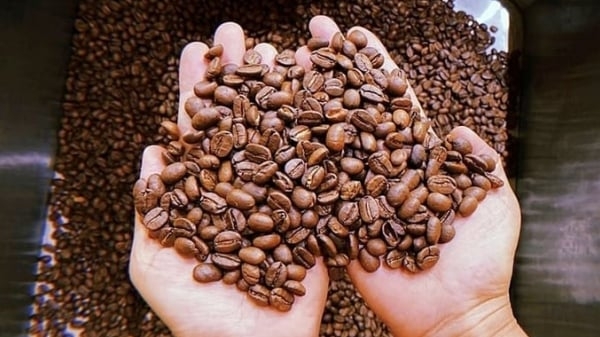
(VAN) Coffee prices on May 13, 2025 decreased by VND 1,200, trading around VND 125,500 – 126,000/kg. Global coffee prices also fell sharply.
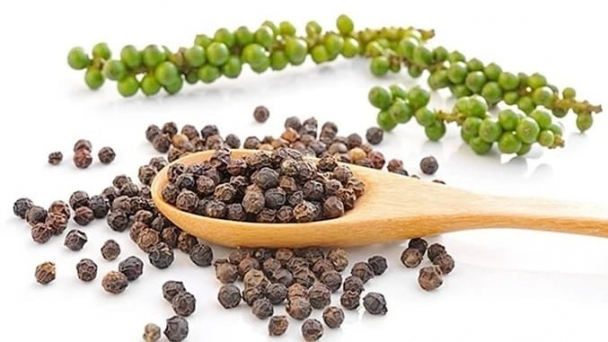
(VAN) Pepper prices on May 12, 2025 in the domestic market are hovering around VND 151,000 - 152,000/kg, while global pepper prices also remain flat.
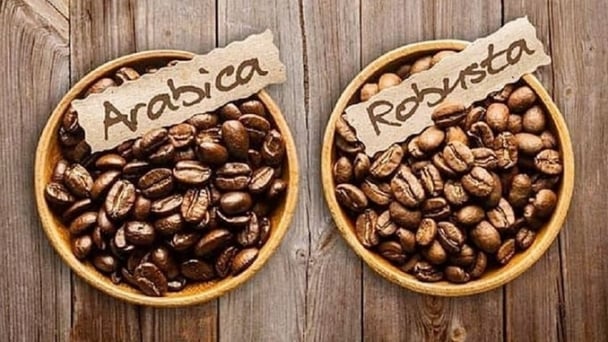
(VAN) Coffee prices on May 12, 2025, continue to trade around the range of VND 128,000 – 128,200/kg. Meanwhile, global coffee prices remain stable.

(VAN) Rubber prices on May 12, 2025, increase slightly globally. Latex purchasing prices in Vietnam remained steady, ranging from VND 397 to VND 462/TSC.
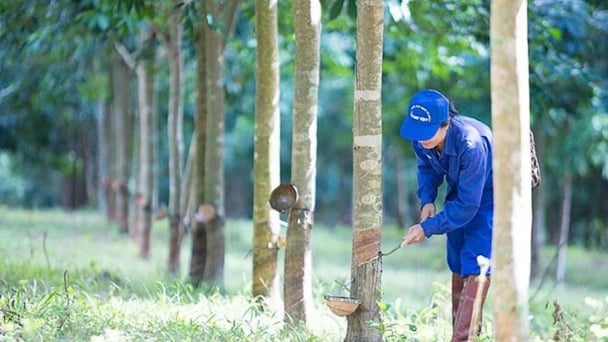
(VAN) Rubber prices on May 9, 2025, on the global market fluctuated wildly. Meanwhile, domestic latex prices remain steady, ranging from VND 397 to 462/TSC.

(VAN) Pepper prices on May 9, 2025, remained unchanged domestically, trading at VND 153,000 – 155,000/kg. Global pepper prices showed little fluctuation.

(VAN) Coffee prices on May 9, 2025, increased by VND 300 domestically, trading at VND 128,000 – 128,400/kg. Global coffee prices also saw a slight uptick.
