May 14, 2025 | 12:01 GMT +7
Hotline: 0913.378.918
![]()
May 14, 2025 | 12:01 GMT +7
Hotline: 0913.378.918
![]()

Fertilizers are such an input for U.S. farmers. Price increases would likely be greatest for potassium (K) given the U.S. reliance on imports, in particular imports from Canada. Impacts would likely be smaller for nitrogen (N) and phosphorus (P), fertilizers given a lower reliance on imports relative to total consumption in the U.S.
On Feb. 1, 2025, the Trump Administration announced, via executive orders, that tariffs would be placed on imports from major trading partners Canada, Mexico, and China. In part, the tariffs were intended to pressure these counties into reducing the flow of illegal immigrants and illicit drugs, specifically opioids, into the U.S. The executive orders call for an additional 25% tariff on imports from Mexico and Canada (with a lower 10% rate on energy-related Canadian imports), and additional 10% tariffs on imports from China – all of which were announced to take effect as of Feb. 4, 2025. On Feb. 3, it was announced that an agreement had been reached that would delay implementation of the tariffs on imports from Mexico and Canada for 30 days.
Canada, Mexico, and China are the top three trading partners with the U.S. Imports from these countries account for more than 40% of the value of total U.S. imports, which have exceeded $3 trillion annually since 2022.
Today’s article examines imports of fertilizer products used to supply the main crop macronutrients of nitrogen (N), phosphorus (P), and potassium (K). The U.S. relies on imports for a relatively small share of its consumption of N and P fertilizers, but is heavily reliant on imports of K fertilizers (see Farmdoc Daily, March 17, 2022).
Import tariffs on fertilizer products, and the materials used to manufacture them, would be expected to have their largest price impacts on fertilizers more heavily reliant on imports to meet U.S. consumption, particularly if import reliance is concentrated among the affected trading partners.
According to the National Minerals Information Center of the United States Geological Survey (USGS, 2025), net imports (imports less exports) have accounted for 6%–13% of total nitrogen consumption, by volume, in the U.S. since 2020. The U.S. is one of the leading producers of ammonia and its derivatives that serve as common nitrogen fertilizers.
Figure 1 reports the value of U.S. nitrogen fertilizer product imports since 2005 from Canada, Mexico, China, and the rest of the world (ROW). Note that 2024 indicates imports from January through November. Since 2020, the U.S. has imported over $4.5 billion worth of anhydrous ammonia and other nitrogen fertilizer products. Imports of nitrogen from Mexico and China have been marginal while an average of more than 30% of annual nitrogen imports (an average of $1.4 billion per year) have come from Canada.
In addition, over 90% of U.S. imports of natural gas — a key input to ammonia production — come from Canada, which were valued at $8.6 billion in 2023. However, increased domestic production has resulted in the U.S. being a net exporter of natural gas since 2017. For example, in 2023 the U.S. produced over 41 trillion cubic feet of natural gas, while importing less than 3 trillion cubic feet and exporting over 7 trillion cubic feet (see Natural Gas Annual Summary from the Energy Information Administration). Thus, import tariffs would be expected to have less of an impact on nitrogen fertilizers via higher natural gas prices.
USGS data on phosphate rock indicate net imports have accounted for 6%–16% of annual consumption, by volume, in the U.S. since 2020. Figure 2 reports the value of U.S. phosphorus fertilizer product imports since 2005. Less than 1% of the more than $500 million in phosphorus fertilizer products imported to the U.S. in each of the last 3 years have come from Canada, Mexico, and China. Virtually all imports since 2020 have been sourced from Peru and Morocco.
USGS data on potassium indicates net imports have accounted for over 90% of U.S. consumption, by volume, consistently since 2020. Canada is the leading global producer of potash, followed by Russia, China, and Belarus. The U.S. produced less than 1% of total global potash production in 2023.
Over the last five years, U.S. potash imports have ranged from $2.5 billion in 2020 to over $6 billion in 2022 when prices for fertilizers peaked due to effects of Ukraine-Russia war (see Farmdoc Daily, April 5, 2022). The U.S. sources its potash primarily from Canada, accounting for more than 80% of total imports (see Figure 3) since 2020. Russia and Belarus are the next largest suppliers of potash to the U.S., accounting for roughly 15% of imports.
If implemented, tariffs will have direct impacts on the prices paid by U.S. farmers. Given that 90% is imported, and more than 80% of imports come from Canada, the largest direct impact would be expected for potassium fertilizers. According to the Illinois Production Cost Report, potash prices are currently around $450 per ton. Full pass-through of the 25% tariff could increase prices by more than $100 per ton for supplies sourced from Canada.
While less reliant on imports, other fertilizers could also face price increases, particularly if domestic fertilizers respond with higher prices as the cost of import competitors increase. Tariffs, and resulting reshuffling of trade flows, can also result in persistent longer-term impacts. For example, companies may turn to alternative, higher-cost suppliers for inputs typically produced in Canada and Mexico, with those costs likely being at least partially passed on in higher prices.
The threat of increased tariffs on U.S. imports from its three largest trading partners — Canada, Mexico, and China — have led to significant uncertainty. The increased tariffs were announced on Feb. 1 and were planned to take effect on Feb. 4. However, late agreements were reached with Canada and Mexico on Feb. 3 that will delay the tariff increases for at least 30 more days. If fully implemented at some point in the future, they could impact well over $1 trillion worth of U.S. imports with the potential to increase prices paid by U.S. consumers.
Fertilizers and related products provide examples through which tariffs applied on imports from major trading partners could directly impact costs for farmers. In 2023, U.S. imports of nitrogen, phosphorus, and potassium fertilizer products were valued at more than $10 billion, with more than $5 billion coming from Canada. To provide context, the USDA estimates that U.S. farmers spent a total of $35.8 billion on fertilizers in 2023.
SF
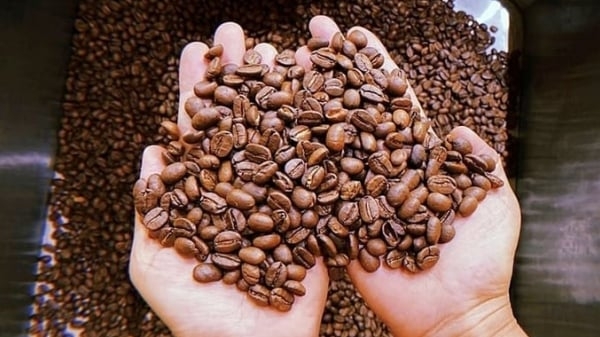
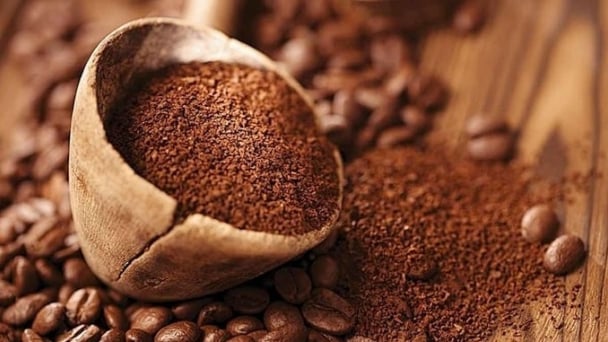
(VAN) Coffee prices on May 13, 2025 decreased by VND 1,200, trading around VND 125,500 – 126,000/kg. Global coffee prices also fell sharply.
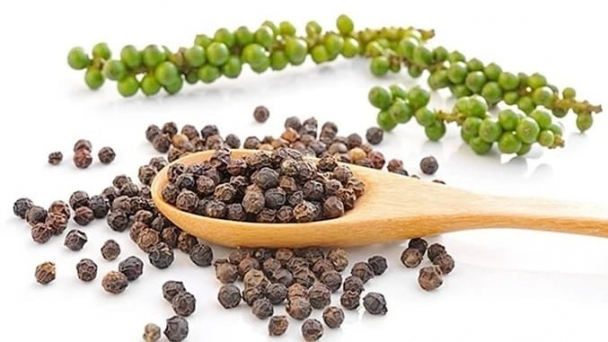
(VAN) Pepper prices on May 12, 2025 in the domestic market are hovering around VND 151,000 - 152,000/kg, while global pepper prices also remain flat.
(VAN) Coffee prices on May 12, 2025, continue to trade around the range of VND 128,000 – 128,200/kg. Meanwhile, global coffee prices remain stable.

(VAN) Rubber prices on May 12, 2025, increase slightly globally. Latex purchasing prices in Vietnam remained steady, ranging from VND 397 to VND 462/TSC.

(VAN) Rubber prices on May 9, 2025, on the global market fluctuated wildly. Meanwhile, domestic latex prices remain steady, ranging from VND 397 to 462/TSC.
(VAN) Pepper prices on May 9, 2025, remained unchanged domestically, trading at VND 153,000 – 155,000/kg. Global pepper prices showed little fluctuation.
(VAN) Coffee prices on May 9, 2025, increased by VND 300 domestically, trading at VND 128,000 – 128,400/kg. Global coffee prices also saw a slight uptick.
