June 4, 2025 | 19:08 GMT +7
Hotline: 0913.378.918
![]()
June 4, 2025 | 19:08 GMT +7
Hotline: 0913.378.918
![]()

This chart shows the difference in value between the July and December 2022 corn futures contracts (the black line) and the CBOT corn daily continuation chart (the red line). The spread between July and December corn was down to less than 50¢ a bushel in February and March 2021. Then, as the corn market turned sharply higher, the spread rallied to just over $1.00 per bushel. When futures corrected down from the May high at $7.75, the spread came back to 20¢ per bushel by September. From that low, the spread has risen to 90¢ as the corn market rallied $1.80 per bushel.
When I got to a meeting not long ago to give a marketing seminar, the questions started flying at me before I could even unpack my bags.
“Al, you taught me years ago to make decisions based on rules and my cost of production, to be a seasonal seller, and to avoid selling in August,” said one farmer. “But has the game changed? What about all the funds and ‘algorithm’ traders?”
His neighbor jumped in: “What about inflation? Does storing the crop make the most sense?”
I asked the farmers to sit tight and see if I answered their questions during my seminar.
In a nutshell, here’s what I said: With high commodity fund participation and the large number of short-term “algo” traders (traders who use computer programs to make super-fast automated trade decisions), the game has changed. The rapid increase in the U.S. inflation rate will also make it more important to make the right marketing and input purchase decisions.
IDENTIFYING THE CAUSE
Let’s review the main factors that caused this sustained rally. First is the huge, record demand from China for corn and soybeans in 2021. The demand for corn from China has slowed in 2022, but Chinese soybean demand has been strong again this year. The inverses in the futures market and very tight cash basis bids signal strong demand.
The second factor is the weather problems in South America in both the 2020-21 growing season and again this year. The total soybean crop in all of South America is now 900 million bushels less than last year and nearly 1.2 billion bushels below what the trade expected just three months ago.
Third is the Russian invasion and war with Ukraine. Ukraine is the third-largest wheat grower in the world, the fourth-largest corn producer, and the largest sunflower grower. As I write this, the shutdown of the ports in the Black Sea has slowed or stopped grain exports and has created a lot of uncertainty about the 2022 crops in that region. History shows that grain exports may be delayed, but they will still come to the market eventually.
Even after my seminar, the questions kept coming: Will the rally continue? How high can prices go?
The answers will depend on the final crop size out of South America. South American nations will have a smaller soybean crop than last year, but odds are good they will have a larger corn crop than last year.
The main factor now is the weather during the critical planting window in the United States, determining planting conditions and crop development. The early indications are for an overall favorable weather pattern. I see the potential for trend line or better corn and soybean yields this year.
The biggest question is that last one: How high can prices go? As always, I answer with the signals I will be watching.
Here are four:
If price rationing develops, watch for a slowdown in exports.
If ethanol profitability moves lower, then corn demand will slow.
Bull spreads work in bull markets. When the spreads begin to widen, then the rally is likely over. This is the No. 1 chart signal to indicate a top.
When the bids switch to the new-crop futures, then it is just a matter of time until the cash bid crashes down to the new-crop bid.
Now back to the questions I got when I walked through the door. Yes, you need to use a new approach. The markets have changed. The market moves faster than ever.
Here is one example of how your marketing strategies could change: Rather than making just three or four sales each year, consider making 10 or even 20 sales.
Some strategies are still solid. I still believe in seasonal sales. I still believe if you get your cash corn and soybeans sold in May and June and get new-crop hedges put on at the same time, then you will like the results at harvest.

This chart shows the difference in value between the July and November 2022 soybean futures contracts (the black line) and the CBOT soybean daily continuation chart (the red line). The spread between July and November 2022 was down to just 60¢ in February and March 2021. Then, as the soybean market turned sharply higher, the spread rallied to just over $1.20 per bushel. When futures corrected down from the $16.77 high, the spread came down to just 20¢ per bushel at the harvest low in November. From that low, the spread has rallied to $1.80. The soybean market rallied from $12.10 per bushel to over $17.00 in late February.
(SF)

(VAN) Vikas Rambal has quietly built a $5 billion business empire in manufacturing, property and solar, and catapulted onto the Rich List.
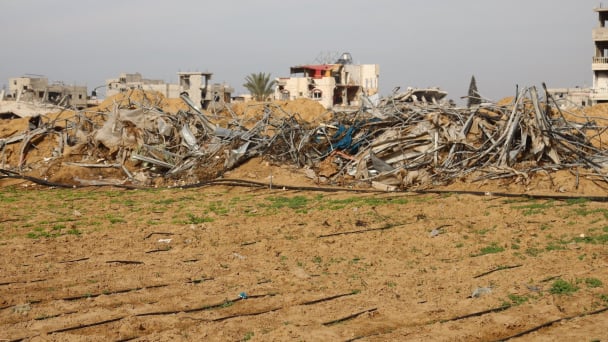
(VAN) Available cropland now at less than five percent, according to latest geospatial assessment from FAO and UNOSAT.

(VAN) Alt Carbon has raised $12 million in a seed round as it plans to scale its carbon dioxide removal work in the South Asian nation.
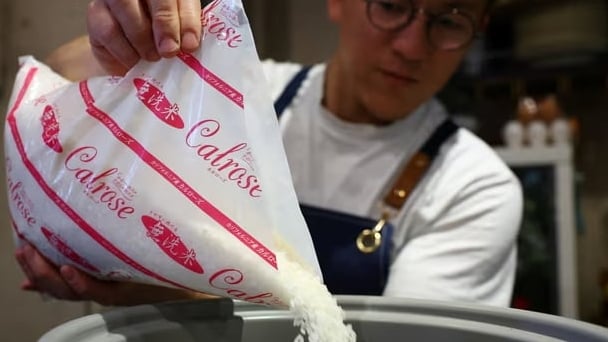
(VAN) Attempts to bring down the price of the Japanese staple have had little effect amid a cost-of-living crisis.

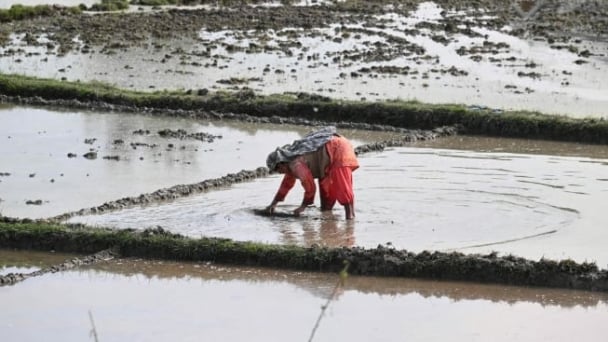
(VAN) Fourth most important food crop in peril as Latin America and Caribbean suffer from slow-onset climate disaster.

(VAN) Shifting market dynamics and the noise around new legislation has propelled Trouw Nutrition’s research around early life nutrition in poultry. Today, it continues to be a key area of research.
(VAN) India is concerned about its food security and the livelihoods of its farmers if more US food imports are allowed.
